Location based to do lists move us towards a map centric way of getting things done. Yes, they improve efficiency but the benefits goes much deeper.
- They give our workers freedom
- They give our managers confidence
- They make our work more pleasant
In short they are awesome.

In this post we are addressing the messy practicalities of running a city.
- Bridges and roads need inspecting
- Fly tipping needs to cleaned
- Bins need emptying
- The grass needs cutting
- Graffiti needs to be cleaned and reported to the police

These problems are not only unpleasant but are also points of political pressure as well as expensive. I live in a student city in New Zealand where fly tipping represents nearly $750,000 a year to deal with. It drains resources from other services and can be particularly difficult when the students all leave town for Christmas.
The Scale of Fly Tipping
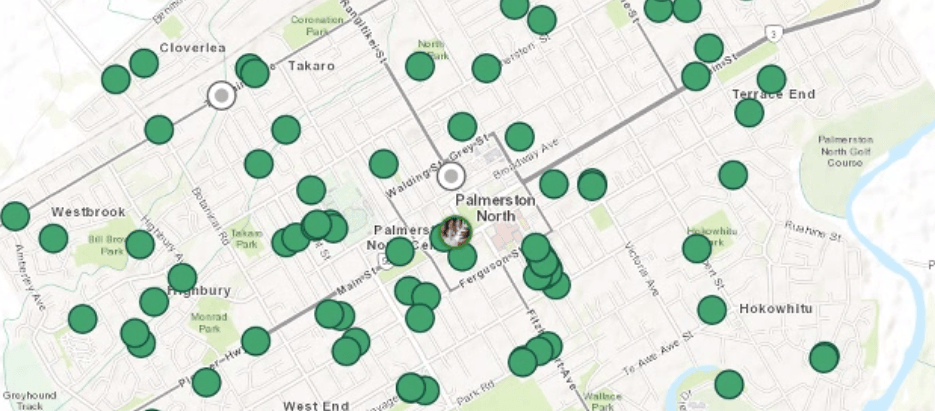
I’ve been specifically focused on recording data on fly tipping for nearly two years now. Our operations department where overwhelmed with work and the requirements to report. When I first began mapping what was available on this issue I realized what an enormous problem it is. We had definite hot spots and a wide spread distribution.


Visualization of this sort was enough on its own to grab the CFO and CEO’s attention. It explained to them why the problem was so expensive but it also highlighted how little we knew about it. Following those early meetings I embarked on a project to get real information about this and other problems in the city recorded into a mapping platform.
Collecting Data with Survey123
 After some initial hesitation, due to the scale of the issue, I dove right into developing an effective way for the operations teams to capture data. I settled on ESRI’s Survey123 app because it was quick to deploy and I could integrate the data directly using the web services, or harvest it using python’s requests module. Survey123 automagically generates a service feature in your ArcGIS online account and creates a related table for storing BLOB’s. I developed the forms with the guys who actually do the heavy lifting and after two weeks we adjusted the forms a little and deploy it for field operations data capture.
Integration User Interface
 The next challenge is to make the data captured in the field available. I used ESRI’s web app builder to provide a platform for management to view all of the features collected. Selecting a point generates a popup with information on all of the questions asked in the survey form. It also contains links to the related table containing the BLOB’s.
I’ve also tried developing the mapping front end with leaflet, just for variety and because it can consume almost any format of data.
RFS Lookup because multiple departments are involved
Following on from this our legal department needed to search for data on customer tickets using an RFS number. Configuring the search widget in Web App builder to search only one field is simple. Getting this feature in place allowed the organisation to connect a customer complaint about fly tipping with the data on its capture and a reference to any legal evidence collected. This is used if offenders are taken to court. Having date time stamps on all work done gives an enormous amount of confidence when dealing with legal issues. It’s not common for my organisation to take someone to court because of the price of doing so but in the case of commercial operators dumping construction waste illegally they do make the resource commitment.

Location based To Do lists
Up to this point I’ve spoken only about data capture in the field. But managing work and getting to the job is just as significant a problem. I chose to tackle data collection first because I wanted to get the operations people used to using technology for capture rather than hand written notes and digital cameras. My organisation uses a system called KBASE, a job ticketing system, to track, escalate and manage requests on behalf of 16 of the councils around New Zealand. It uses addresses to locate problems. Addresses are intended for dwellings while fly tipping typically occurs in parks, roading reserves, rural properties, farms etc. So quite often our operations guys would have to search for up to an hour to find reported fly tipping incidents. This is where location based to do lists come into their own.
Integration with Workforces from ESRI
In order to translate KBASE requests to actionable jobs I’ve used ESRI’s workforce dispatcher/worker model. I’ve prepared another post on working with workforce here for more detail.
- Dispatcher – Organised, translate and assign work
- Worker – Only see an organised to do list of their jobs
Previously the ops staff were taking paper printout of their work for the day, ordering and organizing the paper and working through their list. This is fine for 2 or 3 jobs but when you’re dealing with over 30 requests it quickly becomes unmanageable. It took a bit of work to get the new system in place whereby the office admin staff act as dispatchers, receiving KBASE requests and logging them as precise locations on a map. The workers then only see what they need to be working on, with no clutter, distraction or lost paper. They can begin work from home, record data and locate jobs without needing to come to the office and all using one device.

The most expensive type of tipping
E-Waste is the most expensive category of waste to recover. The only thing you can do to make it worse is throw it down a ditch. That’s the hot spot. TV’s in a ditch. This is very expensive to tidy up. We get a contractor with a crane to go down there and haul everything up. Recycling a TV is about $40, but if you throw it down a ditch it costs $1000 to sort out.
Furniture
Student really don’t take care of their furniture and their particular brand of fly tipping is quite brazen. They put the sofa in the street and go home for christmas if they’re in a good mood. If they’re in a bad mood they put the sofa on the street and burn it. At least they don’t bother throwing it in a ditch.

900 Surveys Recorded
As of this writing I’ve recorded over 900 instances of fly tipping around the city and the data is being used to change city policies.

Graffiti Deployment
The data capture of fly tipping was so successful I’ve expanded the project to collect all of the cities graffiti too. The only real difference here is that the police take a more active role, so I provide the web services for them to consume in real time.

Bridge Inspections
I deployed a similar system to manage our bridge inspections and record real time data from the field for our engineering department. I expect this to go live on 22nd May 2017.
Deployment checklist
If you would like to follow this same model then its pretty simple. Here’s my way of deploying location based to do lists for operations staff once you’ve got an idea of the specific job your targeting.
- Find the worker responsible for + their paperwork
- Find their boss + their reports
- Deploy apps to the workers to replace their paperwork
- Deploy WebApps for the managers to help with their reports
I try to start the project making the workers lives easier. The problems they face don’t change as much as management. If you solve a data capture problem for them once it’s likely solved for a while. Management’s needs are more changeable because as you deliver reports new questions arise.

Leave a comment