
Fundamentally point cloud data is just a lot of points needing to be represented in real or cartesian space. As a colleague recently pointed out to me, computer science is just moving information from one place to another. So the format in which we move data can become very significant and really understanding the schema can be enormously valuable.
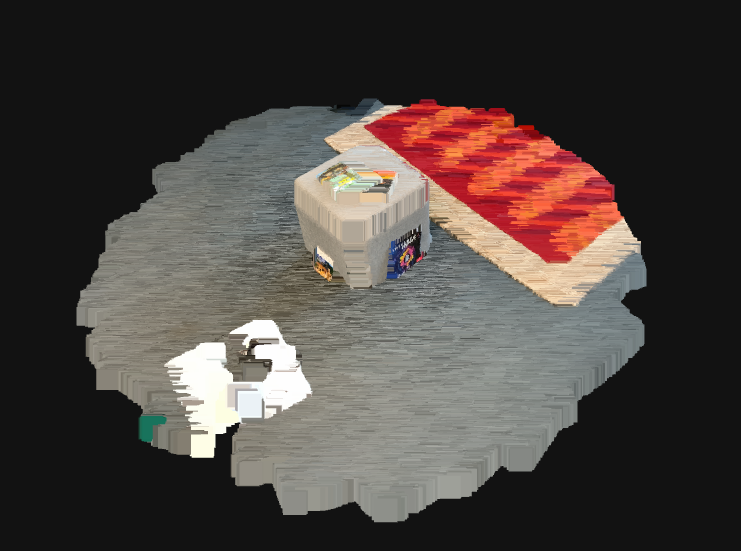
Side note: When I say Cartesian space I mean a non geographic projection. You could use a linear grid such as this or a projected Coordinate system
3D data industry
Currently the world of 3D data is a little confusing and a big reason for this is the sheer number of application; encompassing a lot of new industries, from Surveying using photogrammetry to Zbush for concept artists.
In this post I will share a little about how to work with 3D data in a Geospatial application. Therefore we will discuss the main standard, .las files. However I should point out the .e57 files have a significant place when it comes to laser scanning. This is because you can write individual pieces of the laser scan more easily and so a lot of Surveying hardware uses and .e57 format.
LAS structure
A .las file is an open standard for working with point cloud data, designed by the American Society for Photogrammetry and Remote Sensing. Understanding a data storage standard and structure can help when working with or building a .las file. There are versions of the data storage specification and we are currently at version 1.4, released in 2011.
- The Header: This contains format info, number of points and extent of the point cloud. For my purposes the header usually contains all the info I need.
- Variable length records (VLR): This is where the coordinate reference system info is stored. Which is really a critical record for quality validation.
- Point Cloud Records: This is where the individual points are stored within the format. Each point has the obligatory xyz but other data is also stored such as reflectance value or classification.
- Extended variable length records: This was an addition to extend the VLR in the release of v1.3
These are the fundamental chunks of a .las file so however you interact with one, these are the lowest level at which to consider the format.
How to read a .las file
There are three libraries you can lean on in Python to make this easier. Liblas, laspy and PDAL. I’m going to discuss a little bit about these. (sorry I’m not covering installing these. Hint: liblas is best into a virtual environment with pip, PDAL is best done with Conda because its a C++ library, laspy is easy with pip)
Reading the Header
Here is an example of me reading the header with liblas and there are a few differences between the version 1 and 2 of liblas, so be cautious with that.
# import liblas
from liblas import file
las_file = "/location/to/your/file/points.las"
f = file.File(las_file, mode="r")
#now we can print the header object!
print(f.header)

['DeleteVLR', 'GetVLR', '__class__', '__del__', '__delattr__', '__dict__', '__dir__', '__doc__', '__eq__', '__format__', '__ge__', '__getattribute__', '__gt__', '__hash__', '__init__', '__init_subclass__', '__le__', '__len__', '__lt__', '__module__', '__ne__', '__new__', '__reduce__', '__reduce_ex__', '__repr__', '__setattr__', '__sizeof__', '__str__', '__subclasshook__', '__weakref__', 'add_vlr', 'compressed', 'count', 'data_format_id', 'data_offset', 'data_record_length', 'dataformat_id', 'date', 'delete_vlr', 'doc', 'encoding', 'file_signature', 'file_source_id', 'filesource_id', 'get_compressed', 'get_count', 'get_dataformatid', 'get_dataoffset', 'get_datarecordlength', 'get_date', 'get_filesignature', 'get_filesourceid', 'get_global_encoding', 'get_guid', 'get_headersize', 'get_majorversion', 'get_max', 'get_min', 'get_minorversion', 'get_offset', 'get_padding', 'get_pointrecordsbyreturncount', 'get_pointrecordscount', 'get_projectid', 'get_recordscount', 'get_scale', 'get_schema', 'get_softwareid', 'get_srs', 'get_systemid', 'get_version', 'get_vlr', 'get_vlrs', 'get_xml', 'global_encoding', 'guid', 'handle', 'header_length', 'header_size', 'major', 'major_version', 'max', 'min', 'minor', 'minor_version', 'num_vlrs', 'offset', 'owned', 'padding', 'point_records_count', 'point_return_count', 'project_id', 'records_count', 'return_count', 'scale', 'schema', 'set_compressed', 'set_count', 'set_dataformatid', 'set_dataoffset', 'set_date', 'set_filesourceid', 'set_global_encoding', 'set_guid', 'set_majorversion', 'set_max', 'set_min', 'set_minorversion', 'set_offset', 'set_padding', 'set_pointrecordsbyreturncount', 'set_pointrecordscount', 'set_scale', 'set_schema', 'set_softwareid', 'set_srs', 'set_systemid', 'set_version', 'set_vlrs', 'software_id', 'srs', 'system_id', 'version', 'version_major', 'version_minor', 'vlrs', 'xml']
I’m utilising this data to make sure we have written the .las file correctly, so I need to get the date written, point record count and min max values. Virtually everything I need is contained here in the header.
Visualising the results
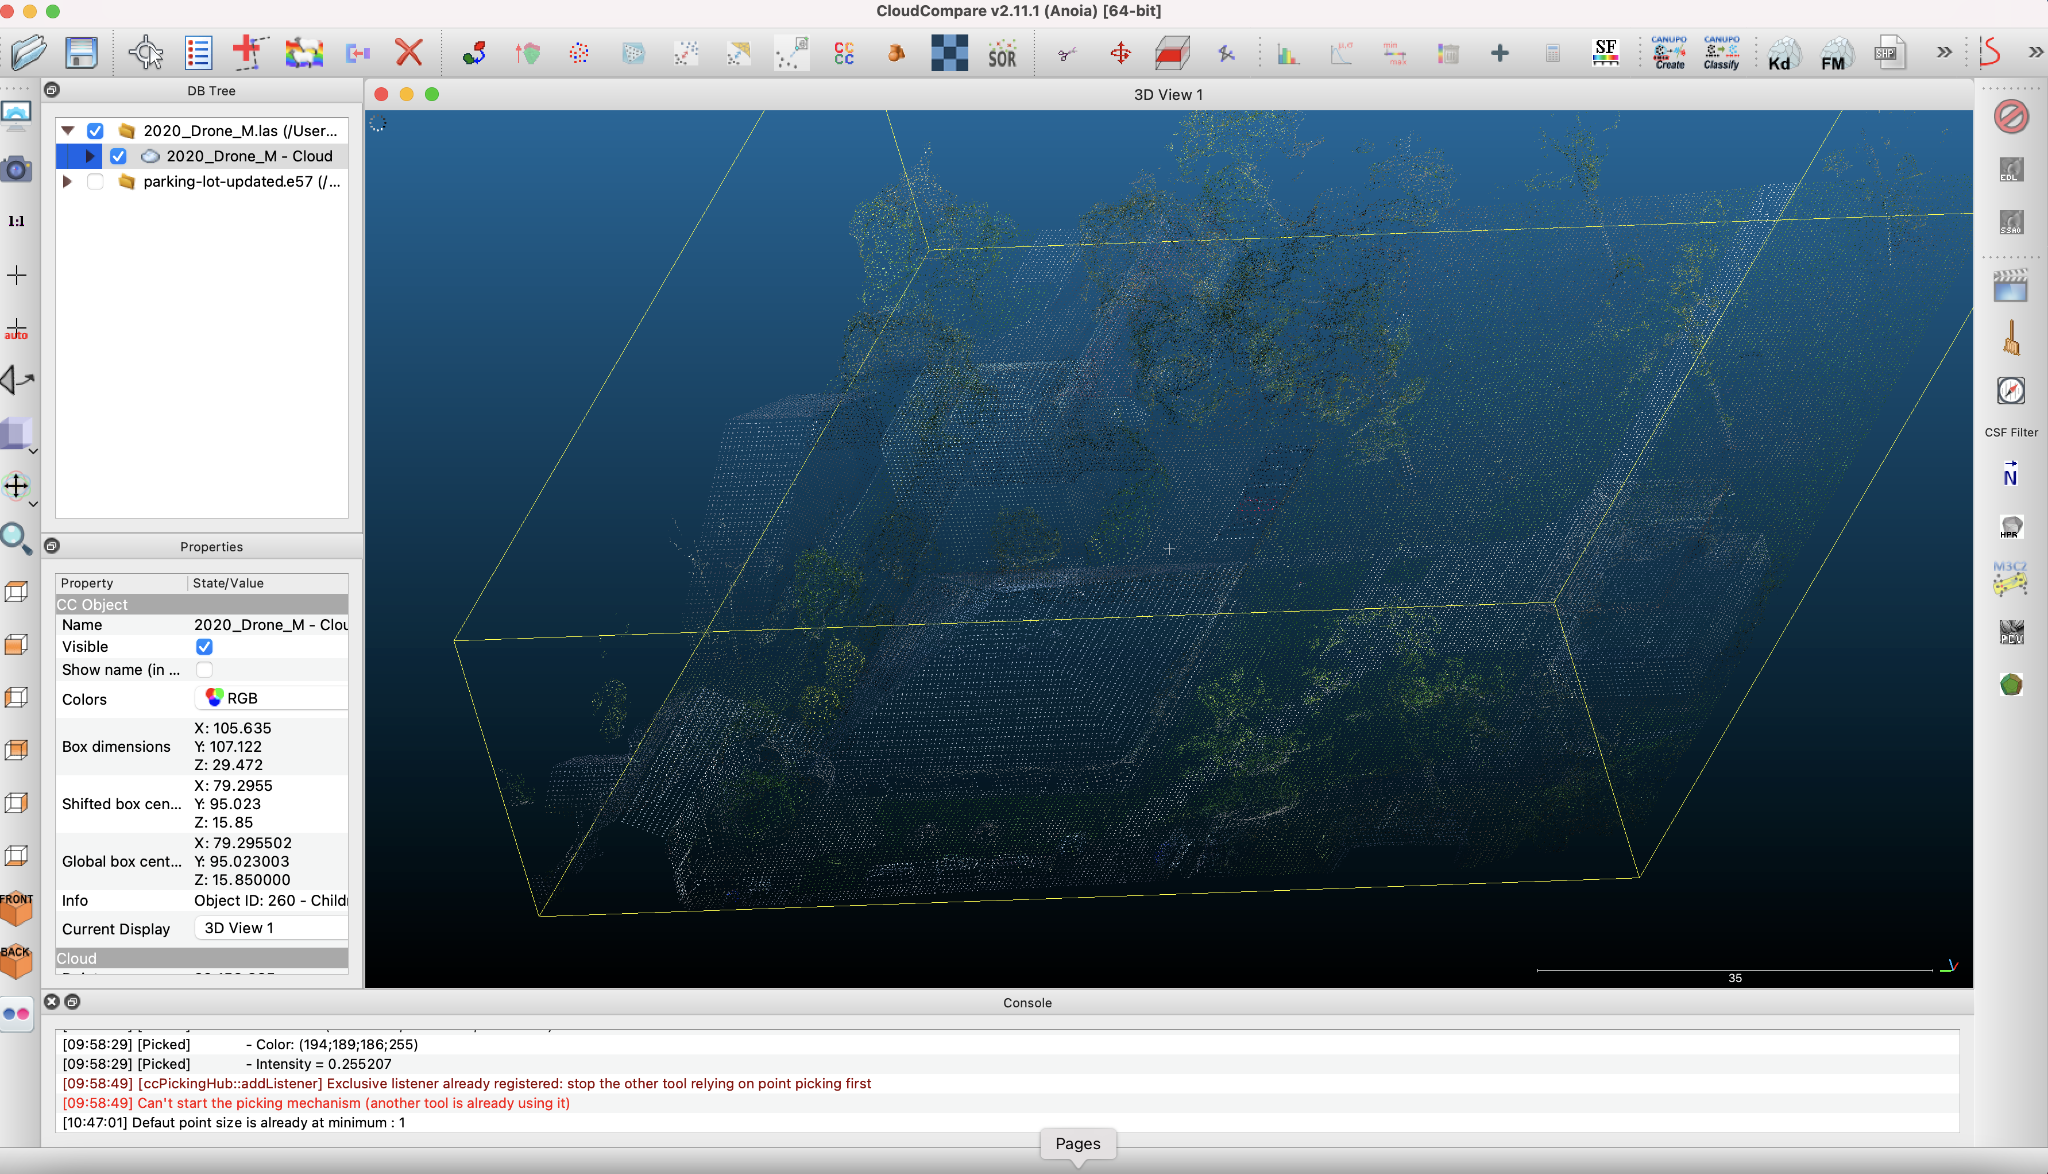
If it’s ok to use an application then Cloud Compare is Mesh lab are both pretty good. Cloud Compare is specifically designed open source software for analysing point cloud data and its free so I’d recommend that one.
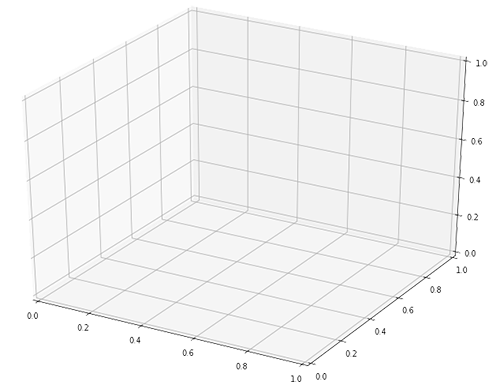
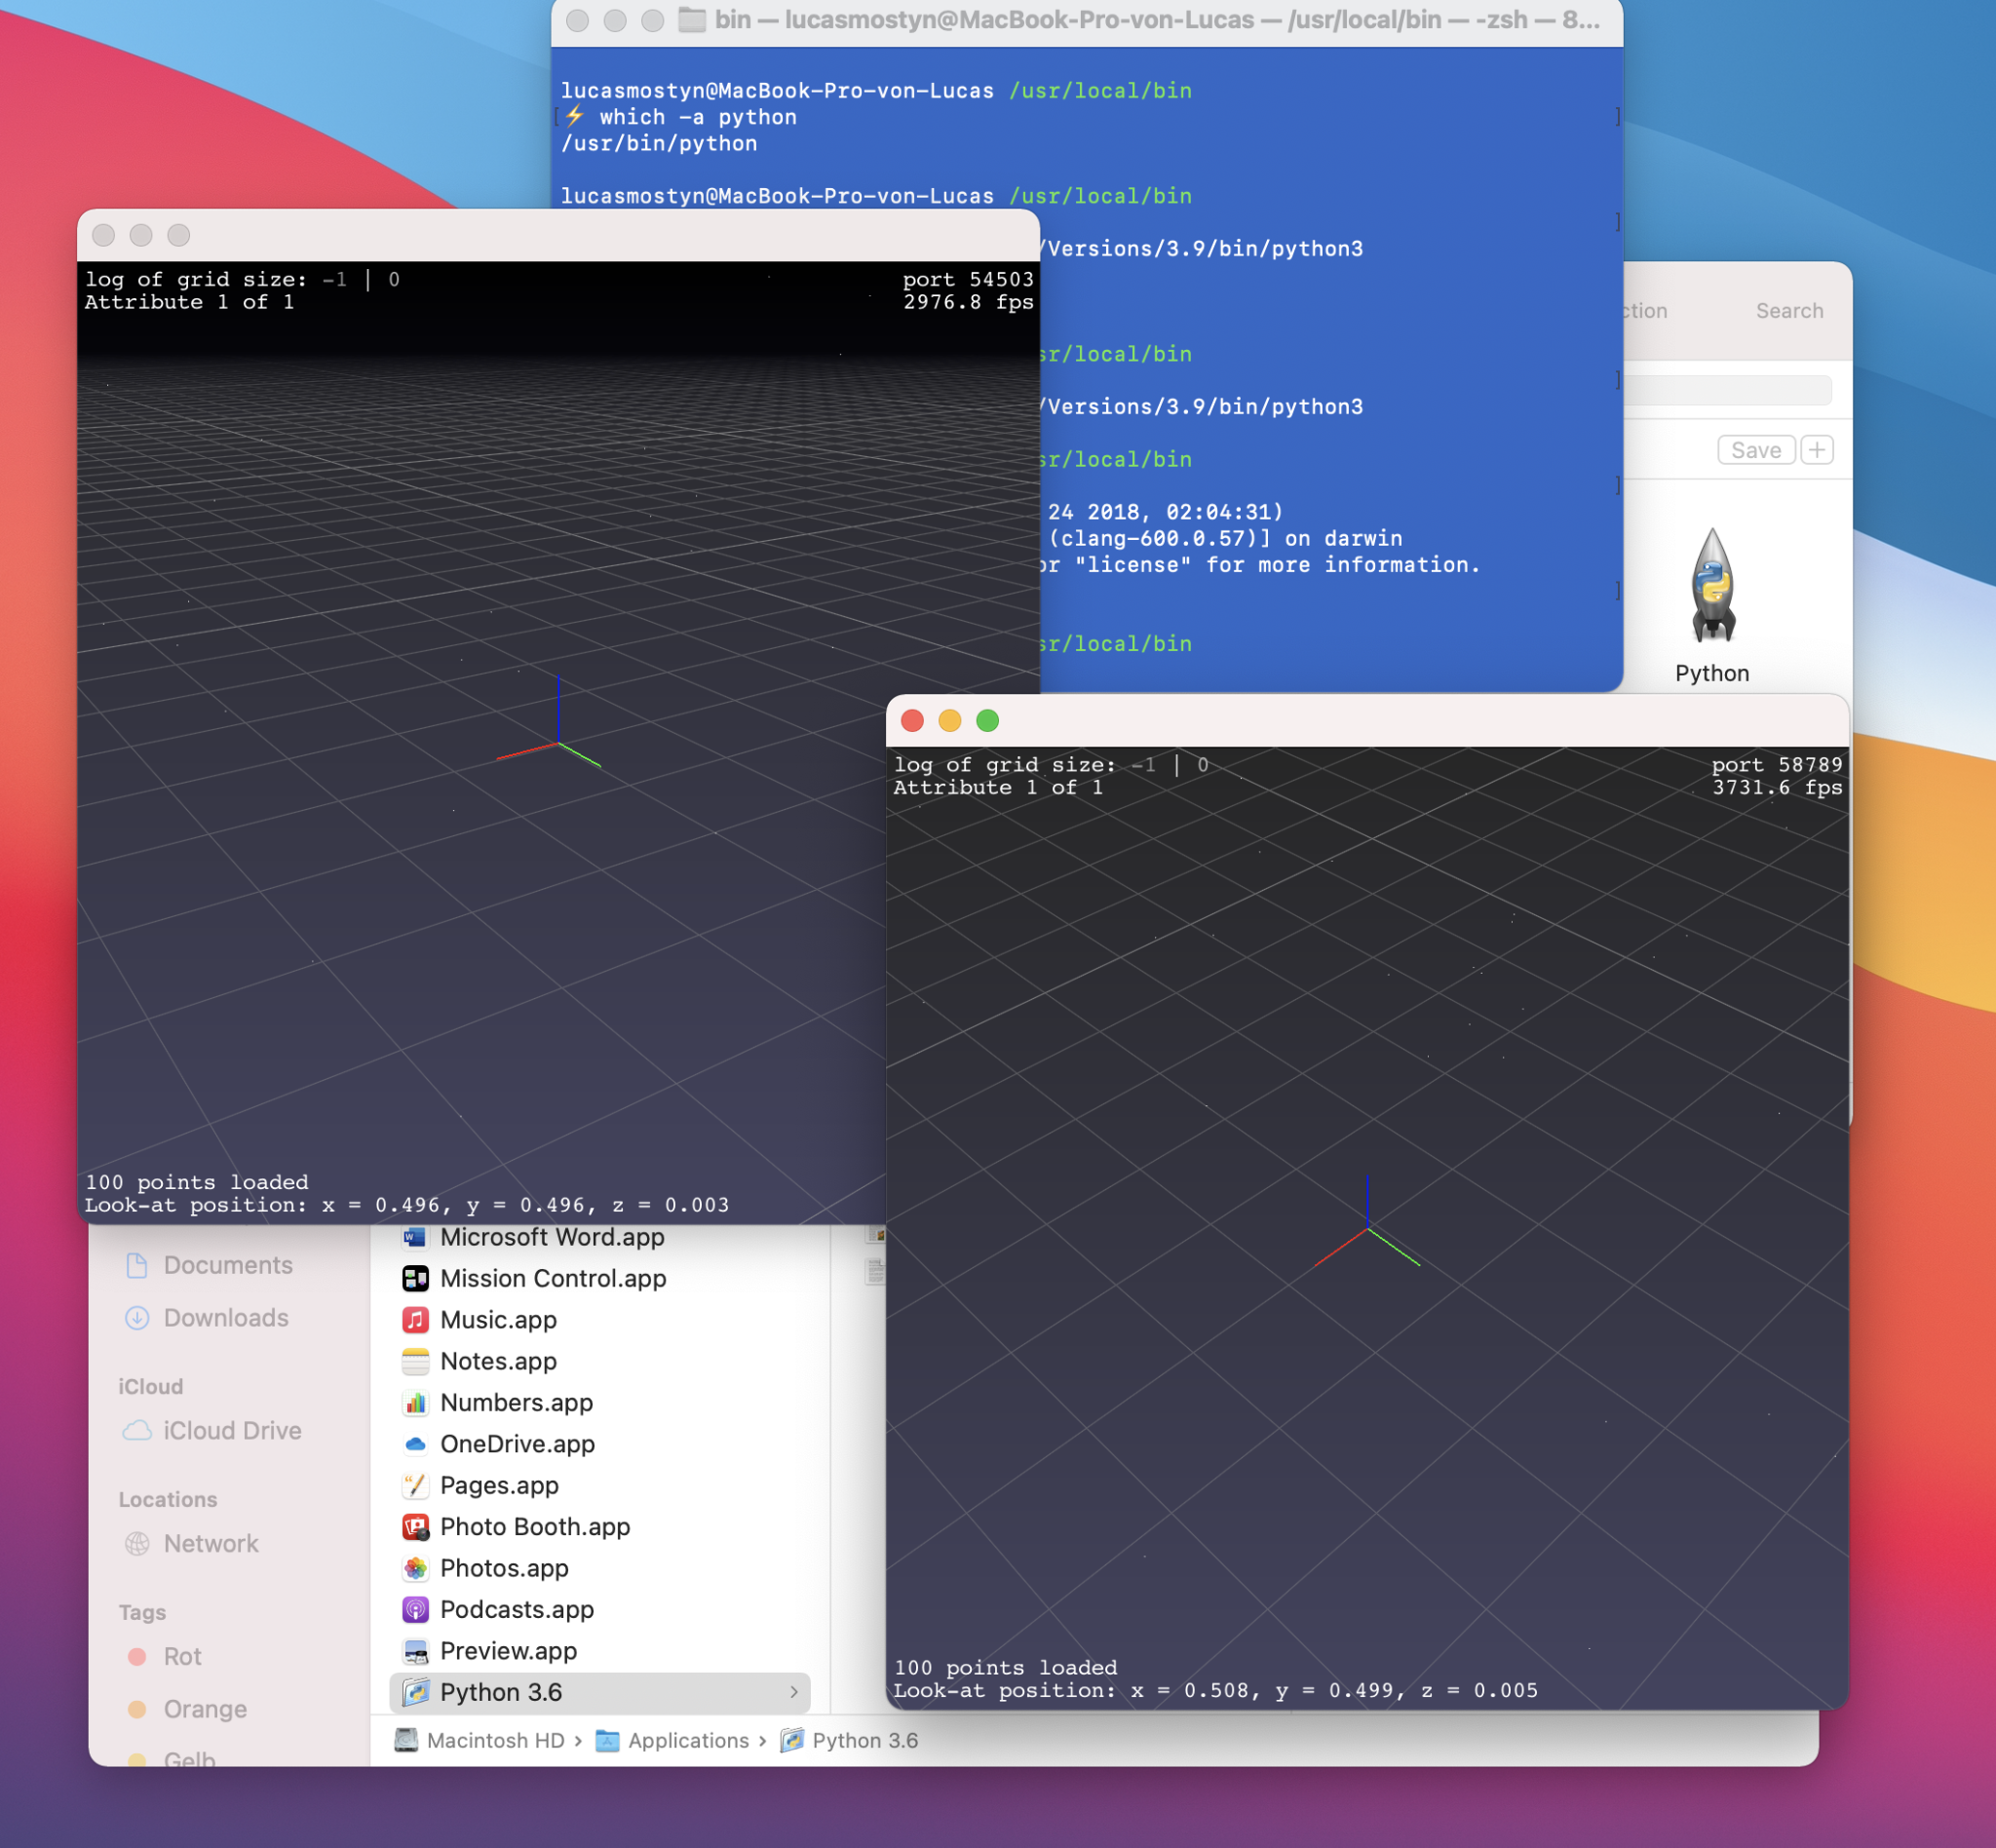
If however you need to observe the data in 3D space programmatically we can, in principle, do that in python too. Here is a 3D display grid in cartesian space.
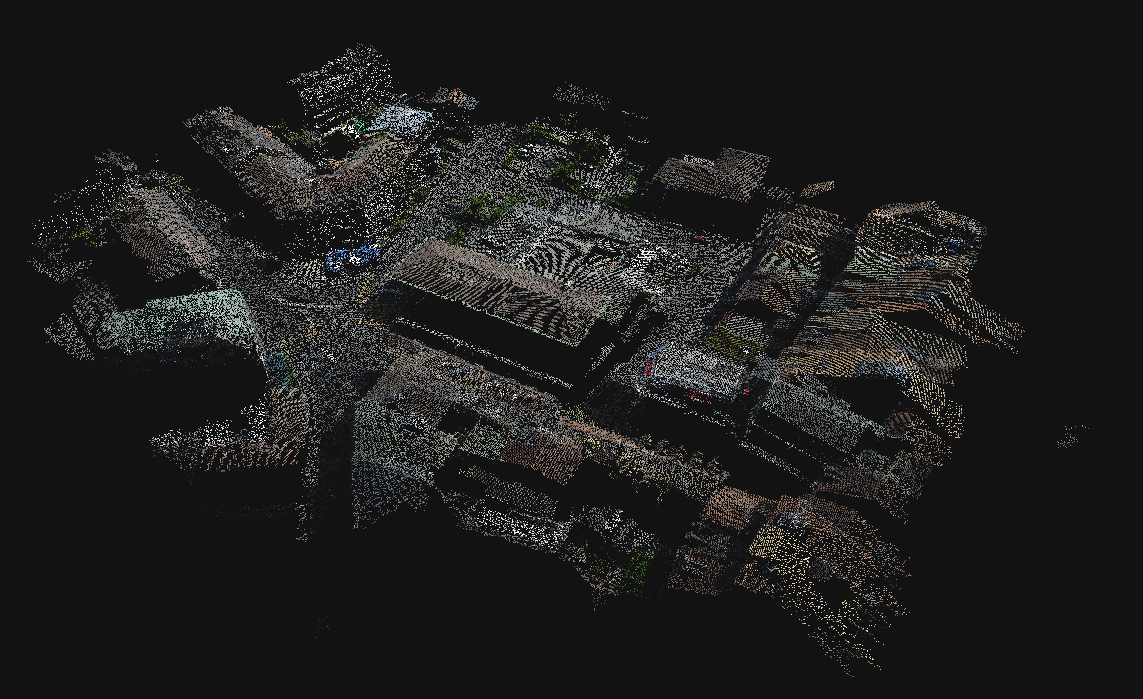
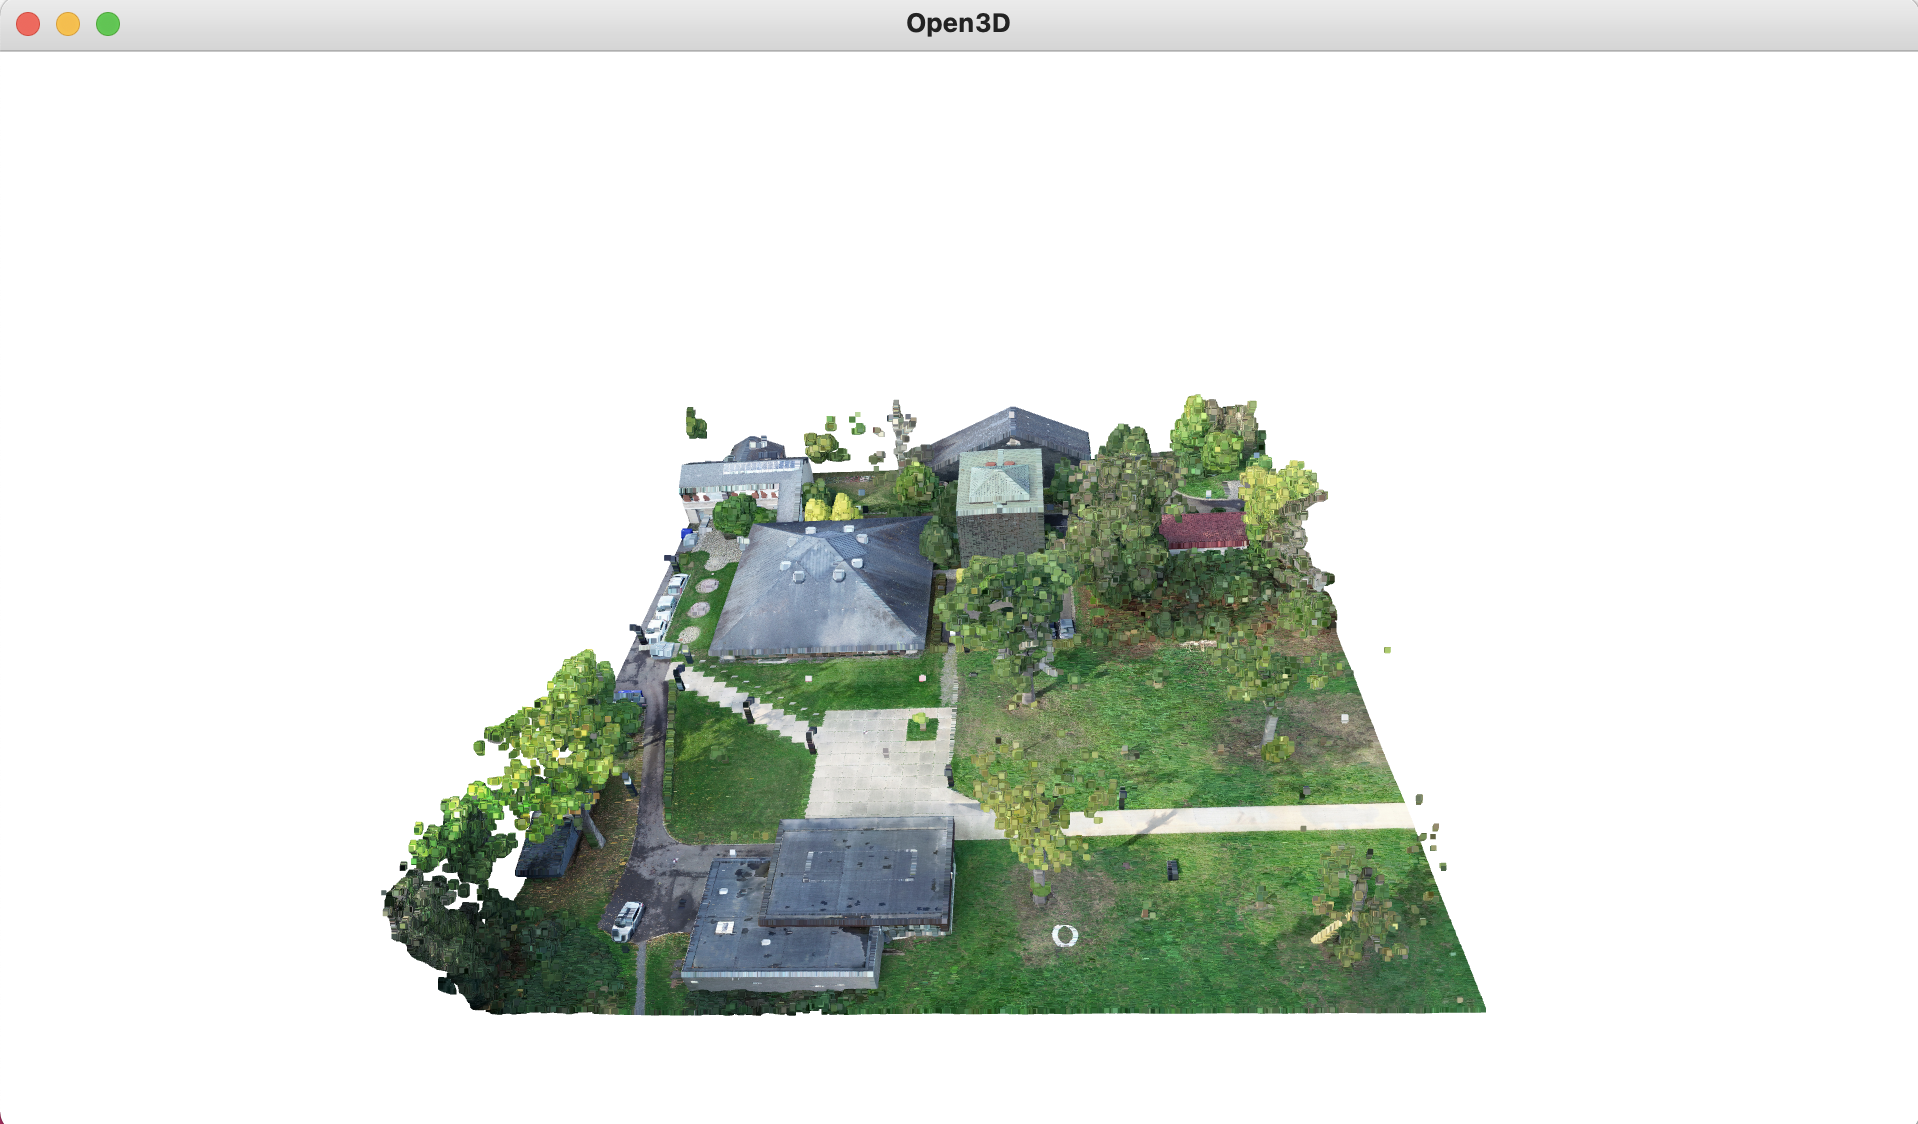
And here are the results once I’ve removed the grid. A super nice clean point cloud in .las format.
Takeaways
Knowing about the specs of a .las and being able to visualize them has given me the ability to perform the following actions in an automated testing suite for the generation of new .las files. My application is an automated test suite and with the above context it is possible to perform the following automated tests:
Checking placement of project
# Read project images and create bounding box
# Read project Header and extract .las bounding box
# Calculate .las centroid
# Confirm the centroid of the .las falls within the image bounding box
# Utilise the benchmark and calculate the distance from benchmark centroid

Check scale (benchmark required):
# Calculate bounding box from las Header
# Calculate ground area in m2
# Compare with Benchmark and check difference
# Raise error if over x% difference for manual inspection

Check number of points (benchmark required):
# Read number of points from Header (tested)
# Raise error if over x% difference from benchmark for manual inspection
Going forwards I’m working to create screenshot snaps to present into a visual highlight comparison. Thanks for reading, Lucas

Leave a comment