I find myself, a geographer, running the change management processes in a Tech company. While it seems like a .yaml chart code problem to people with a CS degree; moving containers in cloud infra seem more too me like a transportation network problem. For me there are three primary areas:
- The logistics of change management
- The decision point or go no go moment
- Communicating the change set
Each of these 3 subjects have taught me something. In short these lessons are:
- Lesson 1: Make complicated things visible and tangible
- Lesson 2: Generate dated reports that focus people, not dashboards that distract people
- Lesson 3: Use visuals to communicate to yourself. Don’t forget this is your superpower if you come from a geography background.
If you’d like to read in more details about any of these lessons please skip into that section! Thanks for reading, Lucas
Lesson 1: Make complicated things visual any way you can
We had a particularly problematic deployment involving incompatible series of Docker containers. It was kind of a disaster. We had not managed to successfully ship the work for 4 weeks. Normally we deal with 20 – 50 containers on any given week and they were backing up. Within the industry its generally considered that higher frequency deployments equal less outages in production. I suspect its true but I know from personal experience that big infrequent releases certainly increase the change failure rate. The change set looks something like this in a highly simplified form.
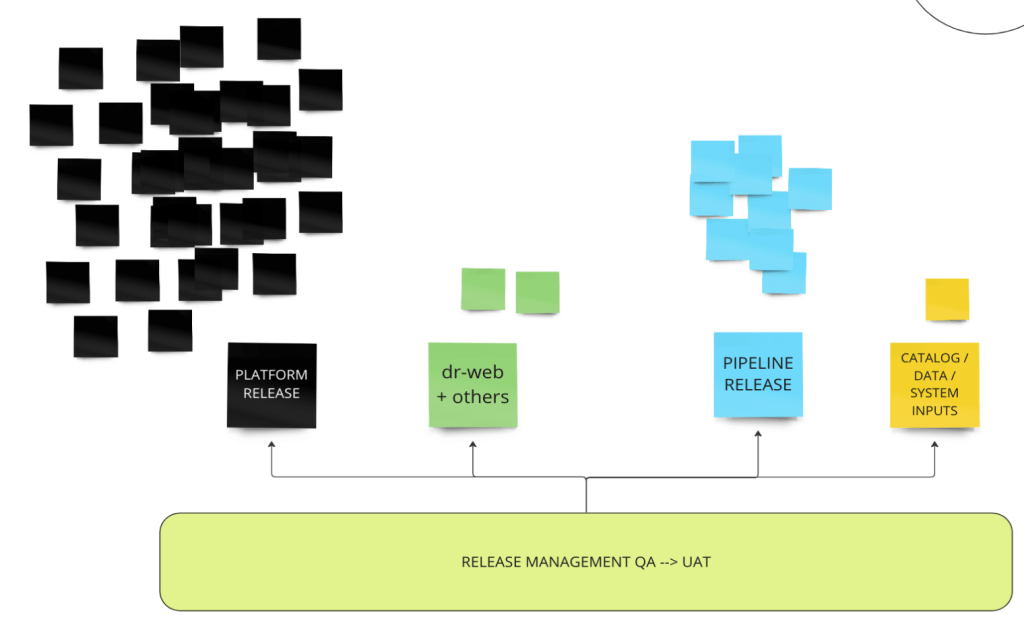
The longer you wait the more changes there are too make if you want to keep up with the dev teams. Eventually I made a cognitive switch. Visualizing the problem as a logistics network is so much easier. Really my son gave me the visual while trying to stack to many Lego people on the same train.
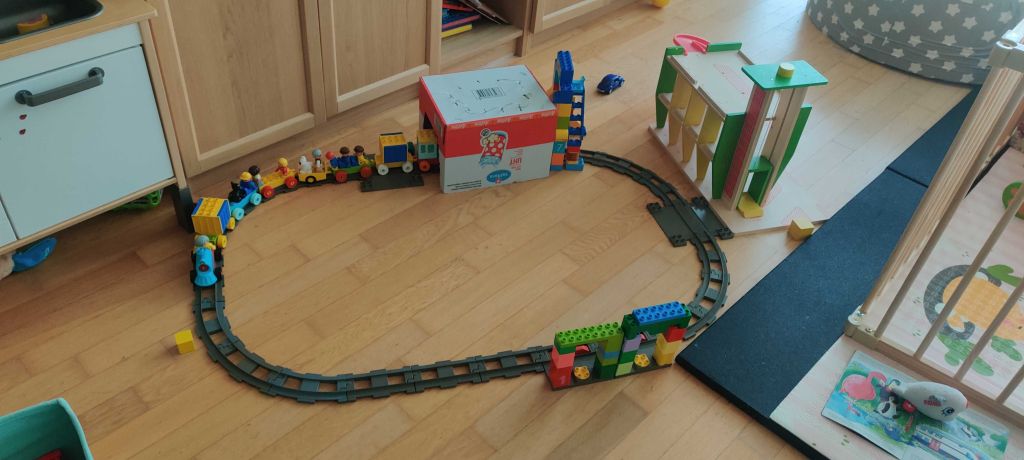
Basically you need to stack the containers nicely and in a certain order on the train. The train has only a set capacity. The train has a departure schedule. While it seems pretty simple its much easier to communicate. In order to move more work you can either.
- Add capacity in the form of tracks and trains
- Add more frequent departures
- Optimize the arrival of your passengers to balance the load
This simple analogy helped me communicate the problem in a way that everyone understands. While I’ve tried to implement all 3 of the above solutions.
Lesson 2: Generate dated reports that focus people, not dashboards that distract people
Writing out a compelling test report is a bit of a challenge. The subject flip flops from extremes.
- Outrage over failed or flaky tests
- Outright boredom
- Acquisitions of incompetence over outdated or irrelevant tests
- Impatience with poor testing
That said, testing is by no means a bad path. Its a kind of super power you can use to make sure that something that you want to get done really does get done. A new feature, a standard or a policy is nice but with a test in place it will be accomplished. Thinking from a test first perspective ensures that you design in a measurable way. As an anecdote I once agreed with a team I was running a new standard. We all agreed to apply one specific label to something once we’d tested it. Everyone thought it was total overkill to set a testing target for this but as it was testing team so I forced the issue a little just to see what would happen. What was considered overkill or too easy for an automated test ended up with a 54% test pass rate; or a 46% failure rate. That is nuts. We people are so tuned up for a positive outlook that virtually any test we write a report for will exhibit more failure than expected. But getting these test reports right is an art, here are some of my favorite subjects within test report writing:
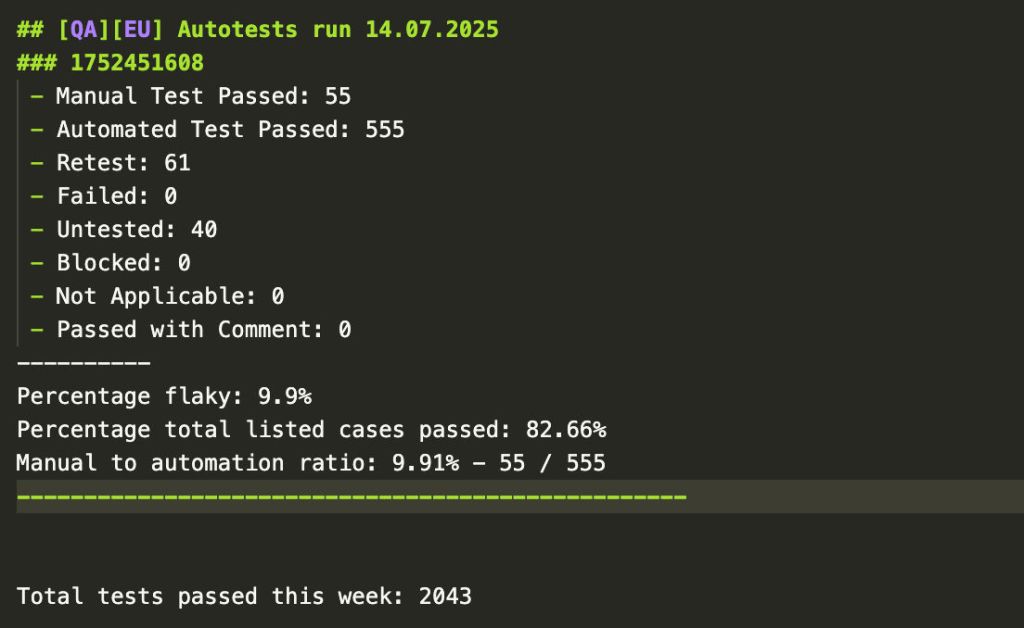
- AI Assistance – Get a test report of every case into a .md or .txt file then AI can help with everything from spelling errors to coverage.
- Aggregation – Total number of tests is helpful to know because management love it and you can short cut the conversation about insufficient testing without burning 2 hours.
- Manual to Automation Ratio – I’m not sure its practical to avoid manual testing but its nice to still track the ratio so you know when its gets above 10% your in trouble
- Flakyness – Its important to track, but I’ve not managed to successfully solve this problem yet. Lookout for a new blog this year on that subject.
In summary, write out a test report into a dated report file in text, not a dashboard. You want to be able to craft the test report to focus people not give them all the information.
Giving everything is lazy; people want to have the information, not the raw data.
Lesson 3: Use visuals to communicate to yourself. Don’t forget this is your superpower if you come from a geography background
If you come from a geography background then your visual IQ tends to be a little more developed. I’ve struggled to effectively communicate to myself which area’s of a large distrubted application are being changed when its purely in text. My group really must use Atlassian with confluence and Jira and its not a good idea to try and change that. However for myself I can convert that text into visuals that help me keep more effective track it. Here you can see I’ve assigned specific area’s of the app to buildings and now I can modify the symbology programatically to get a visual view of where in the neighborhood we are changing things. While its not perfect it does seem to help me.

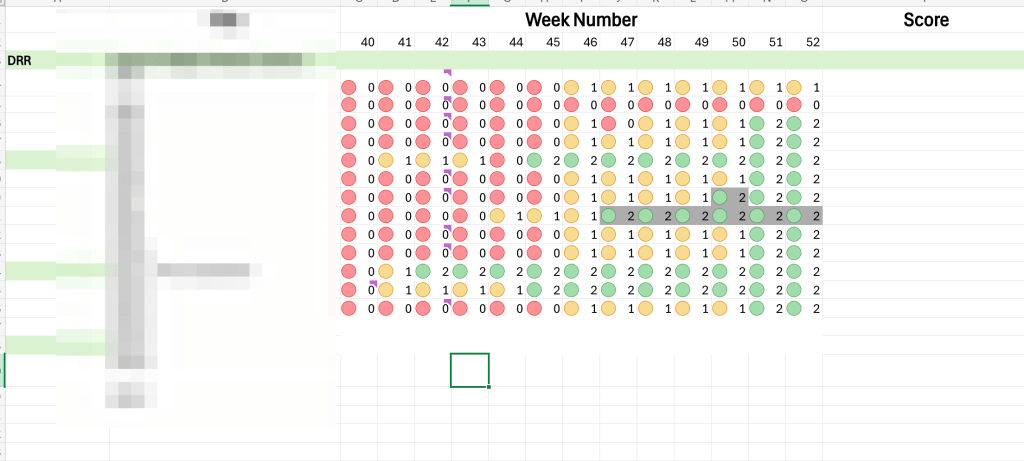
Another view, although a non spatial one is to traffic light the individual MS and subjects by week so I can get a clearer picture to the goal + the deployment status.
These have been my lessons to myself but if you’ve got this far I hope it was helpful to you in some way. Please feel free to drop a comment or reach out via Linkedin or email. Thanks, Lucas

Leave a comment