I find myself wrapping up a QGIS plugin project that started as a pile of loose Python scripts. Its been roughly two years and the project is now closing out (for me at least) so I wanted to write about some of the interesting complexities that came with it. QGIS has something like 200,000 weekly active users; its arguably the most important open-source geospatial application ever built. I didn’t set out to build a plugin for it; I just needed to stop forgetting which script to run next.
From Scripts to Plugin
Honestly it started the way most tools start. A collection of scripts nobody else could use. I was cataloging 3D point cloud data, mesh datasets, and ortho imagery into HxDR, our cloud platform for reality capture. Each dataset needed geometry prepared, metadata formatted, and an API call made. Over time I had scripts for:
- Extracting datetimes from filenames
- Verifying bounding boxes
- Creating custom geometry
- Merging flight paths
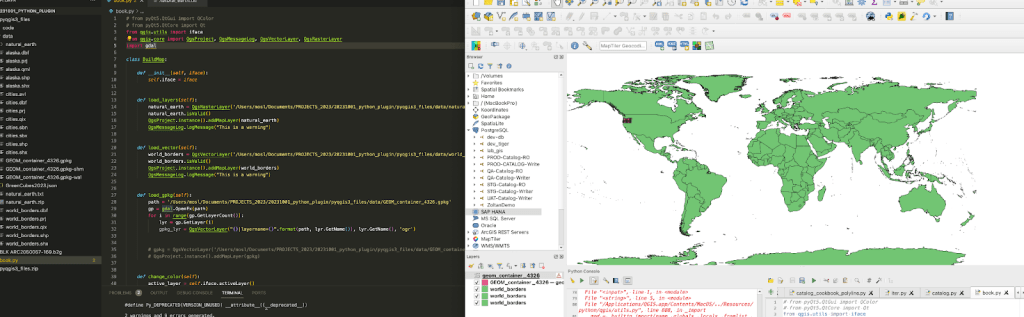
At some point I started forgetting the order. I didn’t want to leave my colleagues guessing about which script does what so I decided to wrap the whole thing into a GUI running inside QGIS. Partly to help others, partly as documentation for how the cataloging process actually works.

QGIS is built in Qt and comes with Qt Designer built in so you can drag and drop a form together. The plugin builder extension generates a starting point, a pb_deploy -y command and you’ve got a basic working plugin. Of course there’s quite a bit of complexity in between those steps but there are books on that.

Reading the Docs (Seriously)
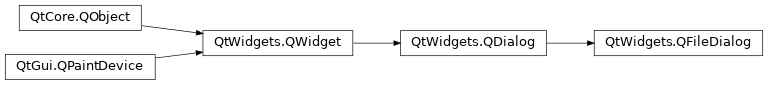
One of the first challenges was learning to read the PyQGIS documentation. This might sound a little dumb but I don’t think many people actually do this most of StackOverflow is full of questions from people who’ve looked at the docs but can’t interpret them. For example:
addVectorLayer(self, vectorLayerPath: str, baseName: str, providerKey: str) → QgsVectorLayer
What’s a providerKey? Turns out in most cases its just "ogr". The help() command became my best friend. Once I got comfortable reading the API surface rather than googling every method the development speed increased dramatically.
The Geometry Problem
This was always the reason I chose QGIS rather than building an admin panel into our web app. 80% of the project effort is data management, metadata manipulation and geometric corrections. Having access to QGIS’s spatial tools from inside the plugin things like Douglas-Peucker for simplification, merging flight block geometry, CRS transformations made the whole approach viable.

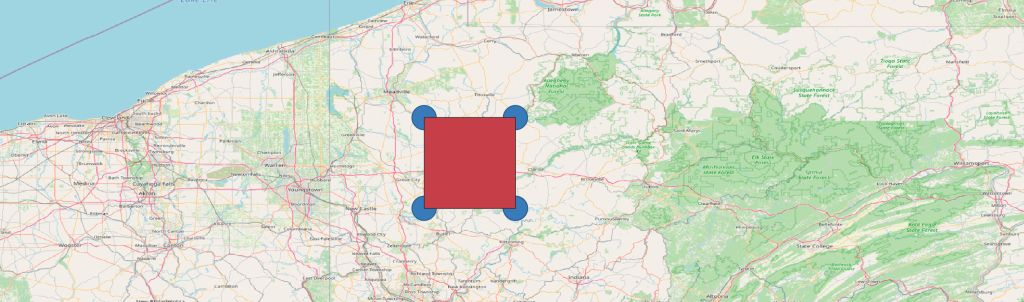
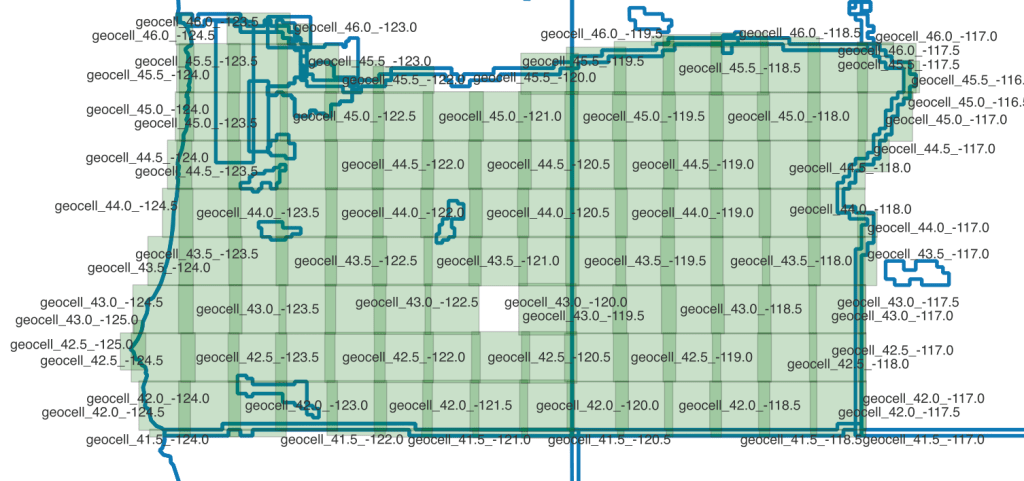
But it came with its own pain. Polygon vs MultiPolygon. The catalog data comes from different sources and different collections structure their geometry differently. Metro collections use MultiPolygon:
[-84.003, 41.750], [-83.416, 41.750]]]]
While HxCP collections use simple Polygon:
[[[10.015, 57.017], [10.015, 56.999], [9.987, 56.999], [9.988, 57.017], [10.015, 57.017]]]
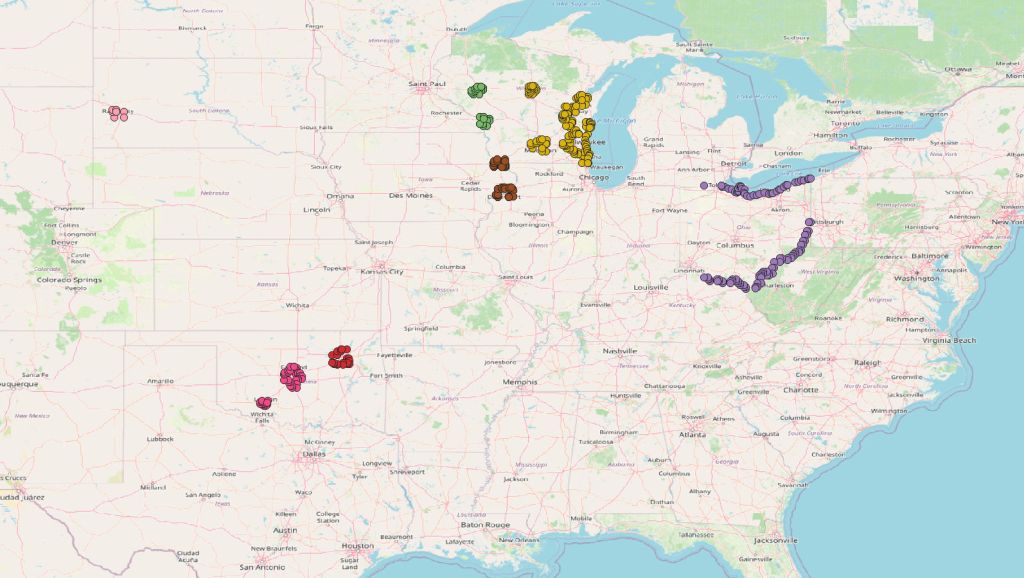
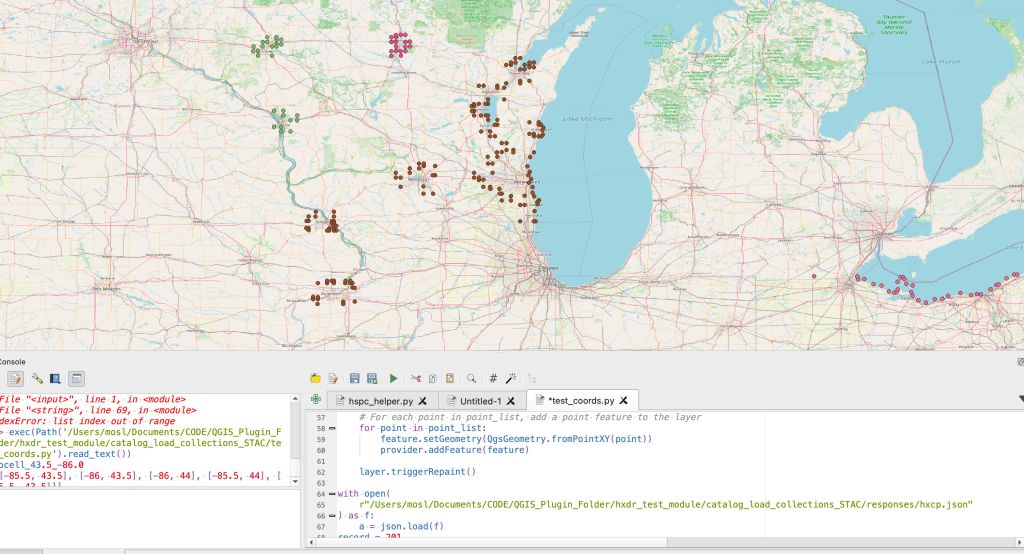
The process stalled when I tried to handle both at the creation stage. In the end I had to step back, ditch polygon creation entirely, and create only points first to visually understand what I was actually working with. Once I could see the vertices on a map the distinction became obvious and I could build the correct handler.

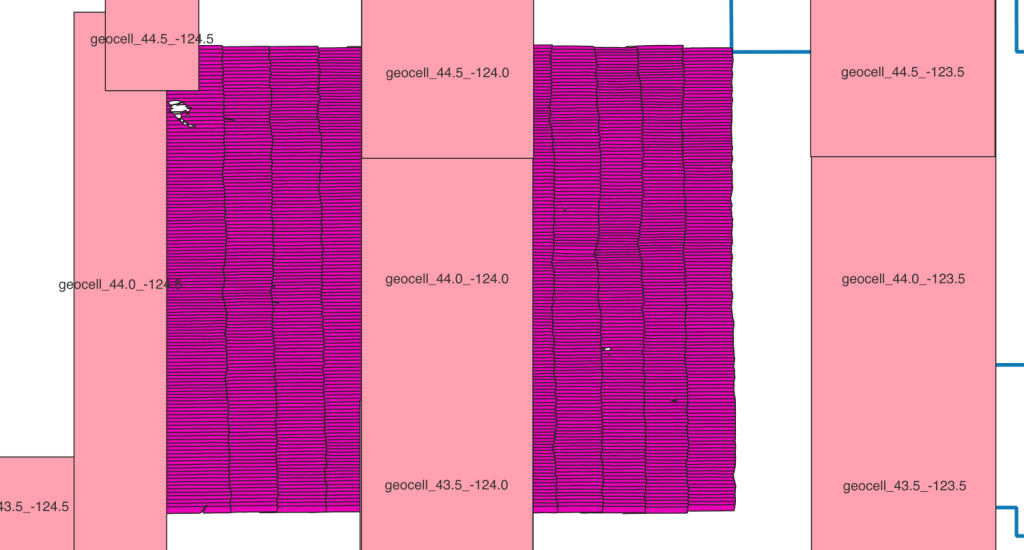
The EPSG:4978 Problem
Processed data is stored in EPSG:4978 an earth-centric coordinate system used for 3D rendering on a globe. But this CRS mixes the X, Y, and Z axes and its terrible for cataloging. Some of my early attempts to convert from earth-centric to geographic were disastrous. I had correspondence with university geospatial departments just to begin to comprehend the issue.
My initial conversions produced shapes with significant errors in rotation, proportion, and position. After quite some time I found a workaround; combine the original flight block data with the planned flight grids which were in a geographic system. By merging those flight paths I got a reasonable representation of the target area.
Those scripts eventually led to the first successful render in HxDR of large-area HSPC (Hexagon Smart Point Cloud) data. A small victory that took way too long to reach.
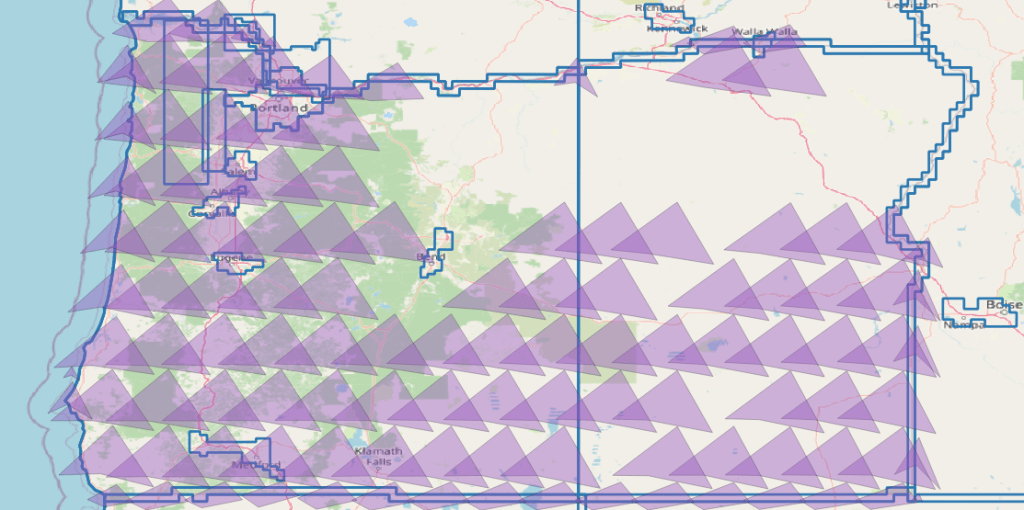
The Helmet Transformation
The Helmert transformation (named after Friedrich Robert Helmert, 1843–1917) is a geometric transformation method within a three-dimensional space. It is frequently used in geodesy to produce datum transformations between datums. The Helmert transformation is also called a seven-parameter transformation and is a similarity transformation.
Essentially you can use the helmert transformation to move from an Earth Centric Model back into a Cartesian or Geographic space. We had a large investigation into the subject here. The real practical tip is to make sure that when proj runs the tranformation there is no The noop string indicates no operation necessary. meaning it didn’t do what it should.
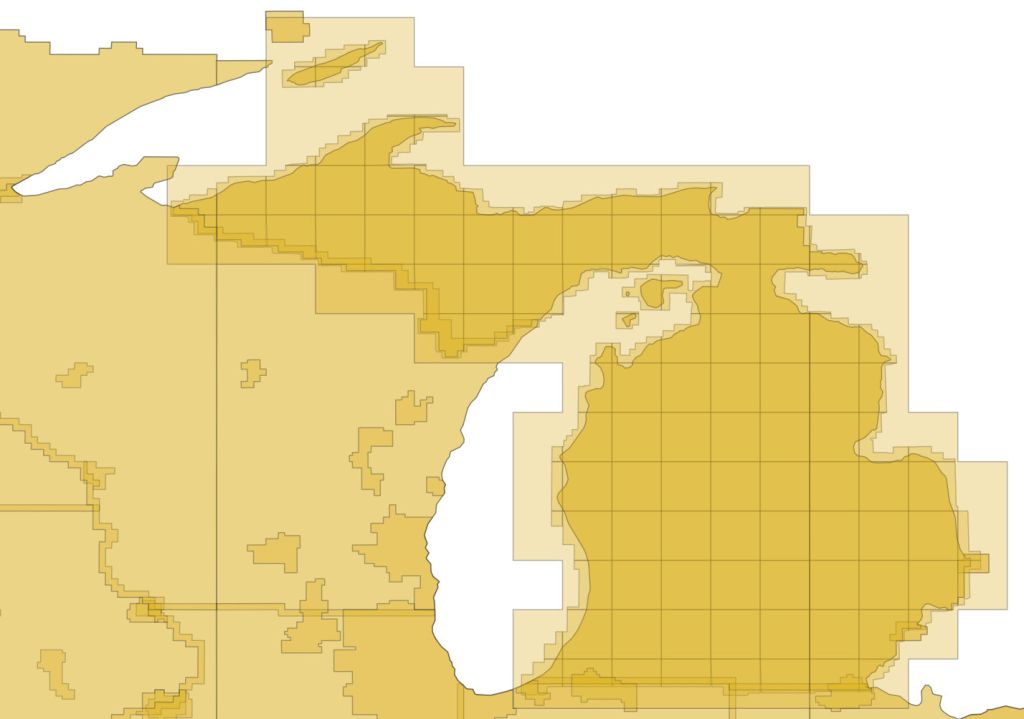
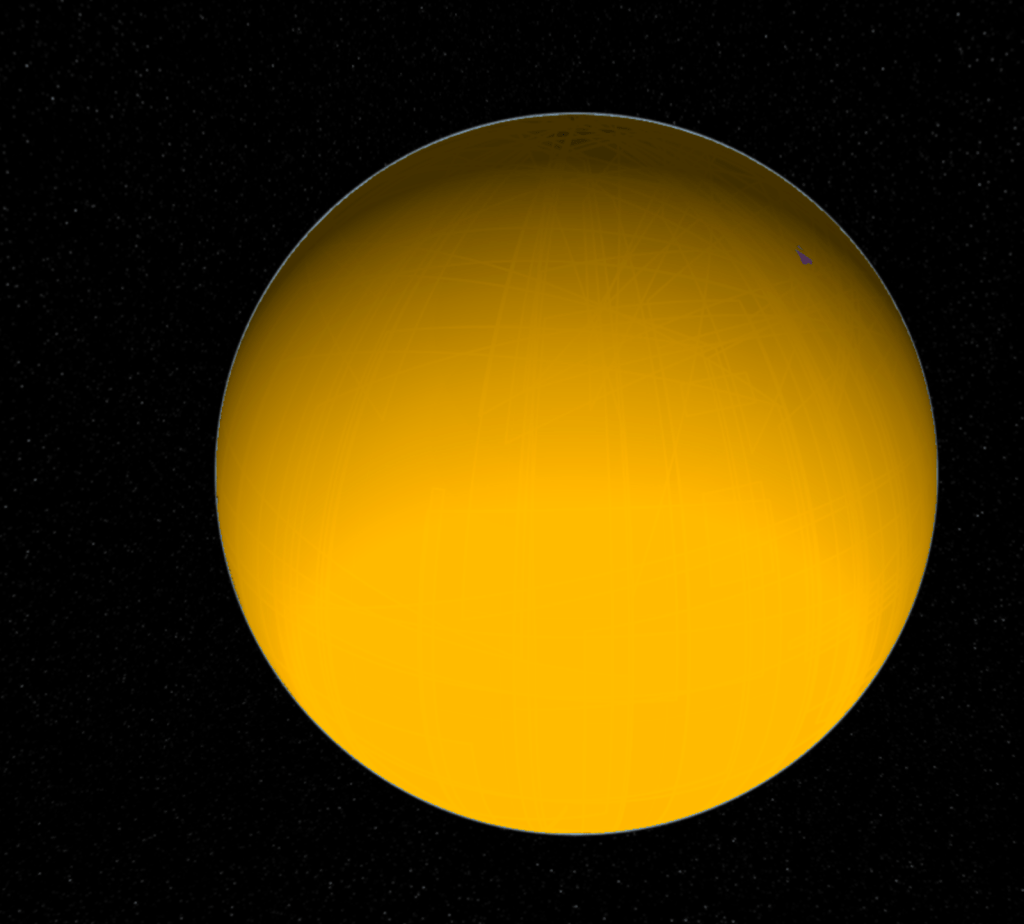
I had endless problems cataloging this way. The geometry was basically all messed up because of an incompatibility between 1 of the 7 parameters between proj and an internal tool which made the results look like this:
GraphQL is Not REST
When the project matured enough for a backend developer to build an API for it I shifted from writing JSON files locally to sending GraphQL mutations. This opened up a new class of problems.
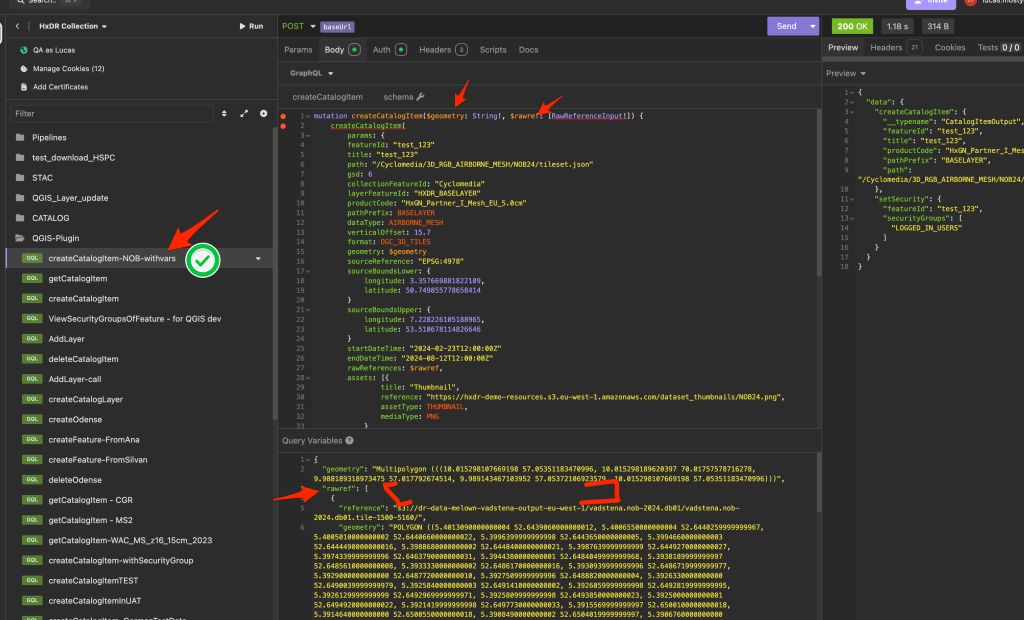
With REST a 200 means success. With GraphQL a 200 often just hides the error message in the response body. This isn’t normal. Once I fully grasped that I added error checking on data.response and surfaced errors to the user via QMessageBox.information. A simple change but it caught dozens of issues I’d been missing.
Streaming Data limits
For me this was the first time dealing with authentication on a desktop machine and it also happened in the early days of AI tooling. The AI tools led me astry on Oauth vs Boto3(from aws). One pathway I tried required a local server in order to make a handshake on a callback. That destroyed my weekend…. I just really like the AWS boto3 python library now. Its works so easy.
The Great Delivery Truck Bug of 2025
My favourite bug discovery on this project. While loading geometry for the country of South Africa the system threw: DataBufferLimitException: Exceeded limit on max bytes to buffer: 262,144.
My way of explaining this to management has been as follows. Imagine we have agreed that sending mail to our office should be done via the post. We have constructed a mailbox at the front of the building. We’ve agreed:
- how letters should be addressed
- in what order information should be stored
- what names are allowed such as title, start_time, end_time
What has NOT been considered because its just a letter is how large the letter can be. Because while we’ve constructed a letter box we should have been constructing a loading bay for delivery trucks. Most of this information is small but geometry is flexible. Unfortunately in this case the geometry cannot be easily simplified.
I used pytest to confirm the issue:
gateway.py::test_delete_catalog_item PASSED [ 33%]gateway.py::test_cannot_create_item XFAIL [ 66%]gateway.py::test_gateway_create_item PASSED [100%]===== 2 passed, 1 xfailed in 2.72s =====
The XFAIL was key it documented that the large geometry was a known system limitation, not a bug in my code. Once the gateway team increased the buffer the test flipped to PASSED automatically.
Lesson learnt, when dealing with geometry communications over a network; consider the complexity and length of the data.
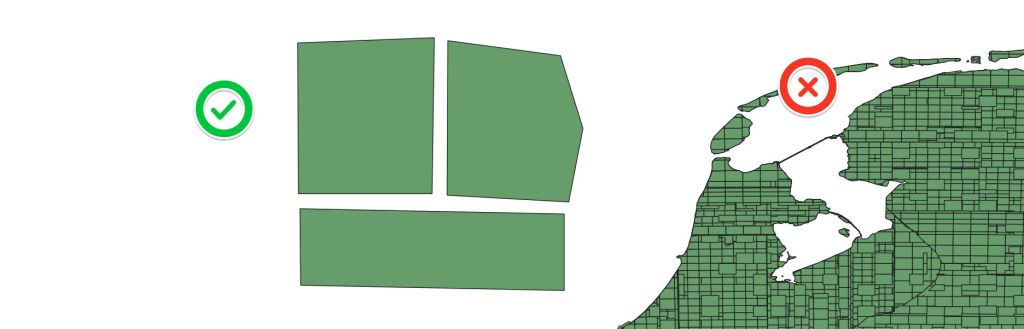
This also happened with one of our integrators!
Clearly a common mistake, but I legitimatly had to delete major parts of NL from our DB because their server wasn’t able to handel that amount of geomerty.
Lessons Learnt
If I were to do this project again:
- Start with a public repo — settling the open source question early avoids months of back and forth
- CI/CD from day one — I added proper versioning, tagging and branch strategy at v0.6; should have been v0.1
- Test-first from the start — my first unit tests came late and initially couldn’t detect real issues. Starting with pytest and a test strategy doc would have saved significant debugging time
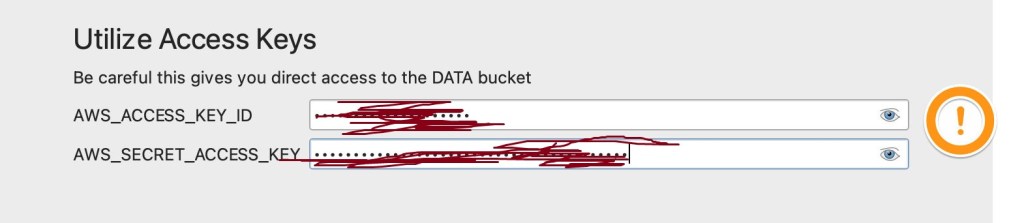
- Never build software dependent on documentation; build documentation into software — this one burned me with credential management and config files. If the system can’t tell you how to use it, documentation will drift
- Central config file — version numbers, environment URLs, credential paths. One source of truth, imported everywhere
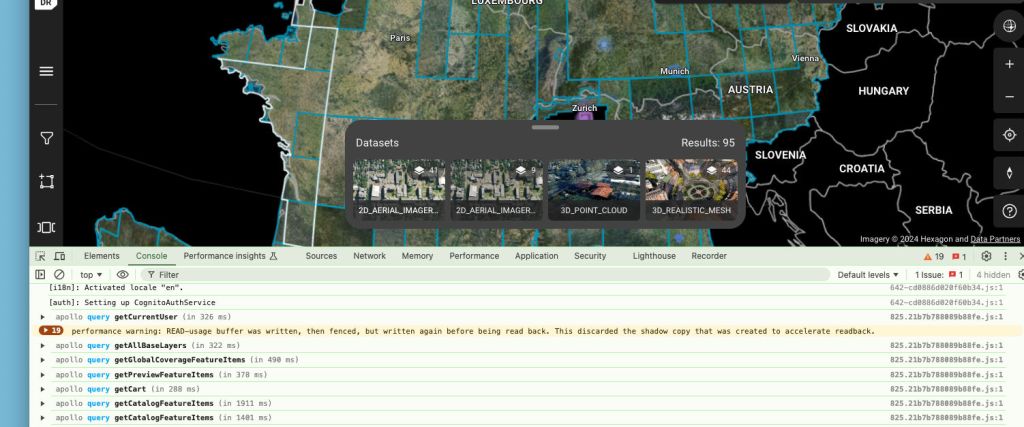
The Current State
The plugin was deployed to the QGIS plugin store as hxdrjsonbuilder. Its gone through eight major versions, handles 2D ortho, 3D city meshes, temporal mesh data, and HSPC point clouds. It talks to our GraphQL API with Cognito auth, manages geometry across multiple coordinate systems, and has a test suite registered in TestRail.
Its not the prettiest piece of software I’ve ever written but it solved a real problem. Turning a messy pile of scripts into a tool that my colleagues can use without me standing behind them explaining which script to run next. And it taught me more about geospatial development than any course or book could have.
These have been my lessons to myself but if you’ve got this far I hope it was useful in some way. Please feel free to drop a comment or reach out. Thanks, Lucas
p.s if writing your own tests around gateway limits, I’d recommend naming things more professionally. def test_gateway_can_fit_delivery_truck(auth_code): wasn’t a great decision in retrospect.

Leave a comment