For many people, a city’s success is judged aesthetically. Basically how pleasant an environment is it.
One of the issues which affect this is graffiti. To visualize the severity, scale and scope of this problem I’ve put together a little infographic for discussion, criticism and comments. The title of which I’ve decided to emphasis the financial cost of the problem, setting it at approximately $25,000 per year based on an investigation of SLA funding within the organisation. This kind of analysis is only possible with people on the ground collecting good quality data so saved a little space in the title to give them credit.

Main Data Display
For the display I had a choice between severity and frequency. I’ve aggregated the incident data and chosen to display frequency on the main map display. With the aggregated points, the larger dots represent 10 incidents within the last year, and the smallest represents one point.

3D representation of severity
Incident severity is import but rather than point aggregation I’ve decided to go with a 3D visualization. The higher and darker the polygon, the more severe the aggregate incidents within the area. I’ve used the census meshblocks here and the severity is measured by square meterage of graffiti cleaned.

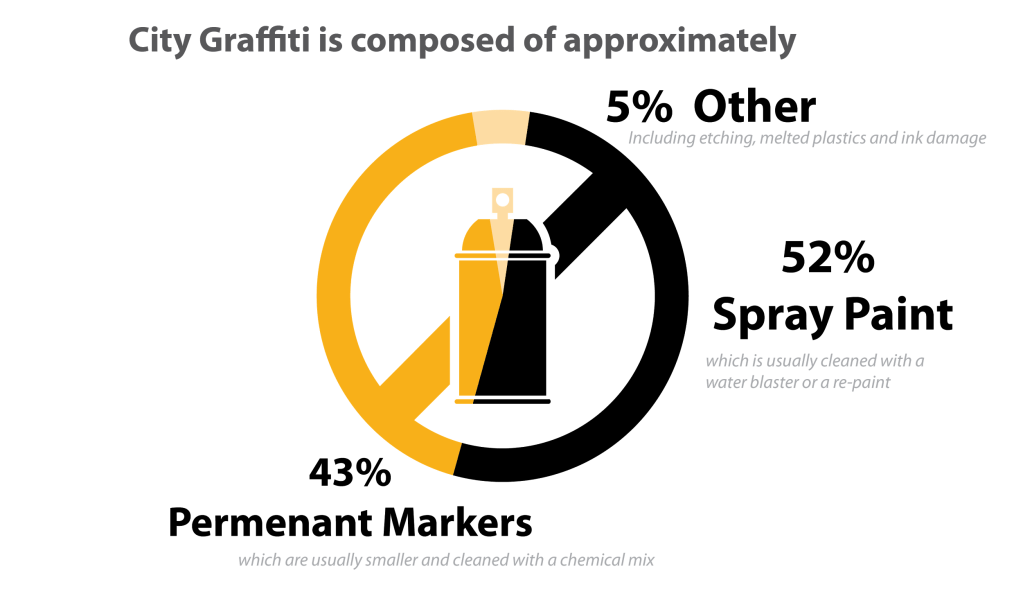
Demonstration of detailed data
Increasingly I find that supplementary data is useful when showing analysis. The type of graffiti really does matter. A pen or marker can be cleaned with chemicals or a quick repaint. Spray paint is typically water blasted. There is also a strong correlation with size of the graffiti and the type. Marker pens tend to be small. Whist I have one incident of spray paint measuring 30 meters.

Trends Across Time
Trends are one of the most interesting components of data analysis. People love to find patterns. In this situation historical data show something of a decline in Graffiti. I’ve chosen to color the time series as to make it easier for people to compare the different seasons.

Bringing it all together
The final map uses a custom base map I’ve put together for displaying engineering data which requires some more detailed context.

As always, I appreciate you taking the time to read this and please feel free to leave comments and/or criticisms.
Regards,
Lucas

Leave a comment