When mapping at a local scale we’re usually trying to show some sort of targeted data. This makes context important, but not so much that it takes away from the data your trying to show.
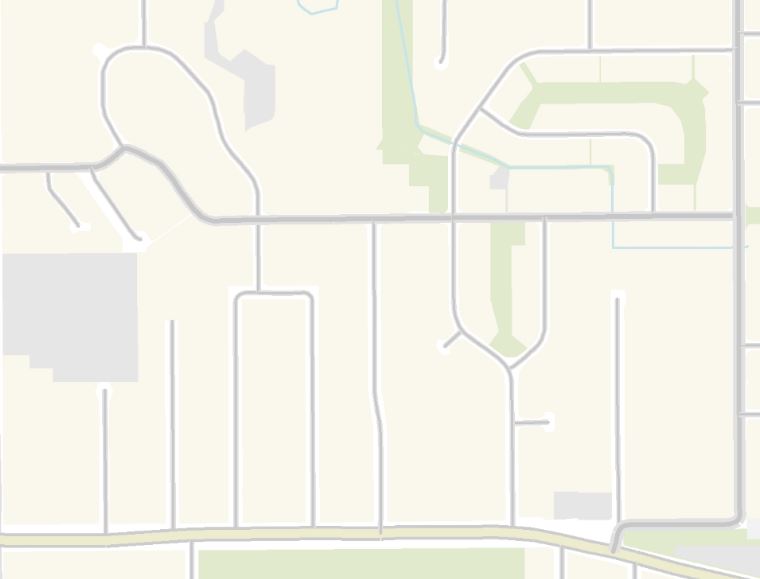
Love or hate the color scheme here it does show data quite nicely. Its basically a blank canvas, with some pastel colors which show off parks, roads, industrial and residential areas. 
When you’re looking at a local scale you don’t get enough context for some purposes. Traffic management for example benefits from being able to visually estimate the amount of traffic. The road sizing helps but doesn’t tell you much about the environment.

Whenever I’m working on a map at < 1:15,000 for engineers I like to add in building footprints. They give context. You can now begin to tell how densely populated the area is.

At a larger scale it starts to look a bit messy. In exchange you gain an understanding of the industrial vs residential areas. It tells you at a glance the nature of the street. Look at the image below and guess where the big trucks will be…
If its too busy then using a color ramp closer to the base can help reduce the noise. 
Try it out next time your looking for a data-centric map with a custom base and let me know how you get on.

Leave a comment